-
General information for wiring diagrams
CLOU follows the DIN EN 81346-2 for marking and identification of components inside of automated test equipment. -

Environmental Conditions For Meter Test
Laboratory meter test equipment should operate under defined climatic conditions. -
Acceptance tests for energy meters
From time to time there are some questions regarding the acceptance inspection (FAT) for energy meters. This paper is to clarify the legal and metrological matters. -
The difference between adjustment and calibration
Calibration means the comparison of a unit under test with test equipment with higher accuracy. -
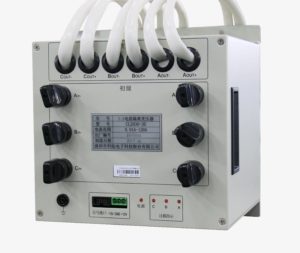
Pulse Calculation for Stationary Test Benches
All energy meters used for billing purpose have a test output for calibration. This can be flashing diode, a pulse output at the terminal or the mark of a rotating... -
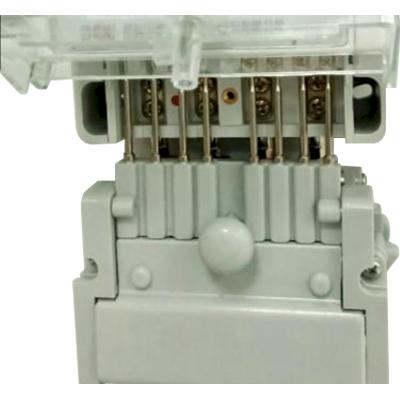
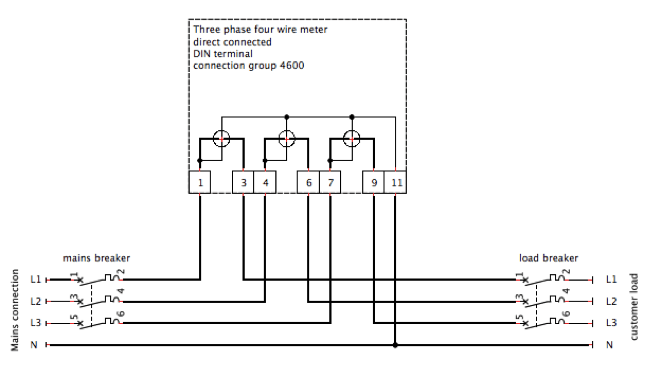
Terminal wiring for electrical energy meters
In meter- or test bench descriptions you can find various expressions, all with the same meaning. -
How long does a no-load test take?
When the voltage is applied with no current flowing in the current circuit, the test output of the meter shall not produce more than one pulse. -
The different current subscripts
Together with tender documents and meter specifications you will find various subscripts related to current. current I without subscriptThis is the actual current flowing trough the energy meter. starting current... -
When do I need Isolation Current Transformers?
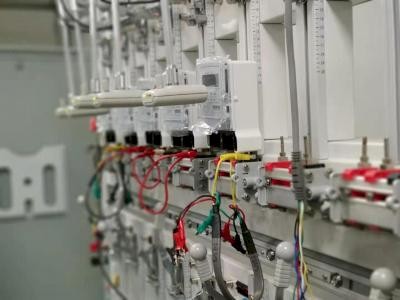
Isolation Current Transformers (ICT) are needed to test more than one direct connected energy meter on a test bench with multiple positions, assuming that the I-P links can not be... -

The Standard Transfer Specification STS
The Standard Transfer Specification (STS) has become recognised as the only globally accepted open standard for prepayment systems, ensuring inter-operability between system components from different manufacturers of prepayment systems. -
The four-quadrant diagram in electricity metering
The interactive diagram shows the relationship between the phase angle φ, apparent-, active- and reactive power respective energy in accordance with clauses 12 and 14 of IEC 60375. -
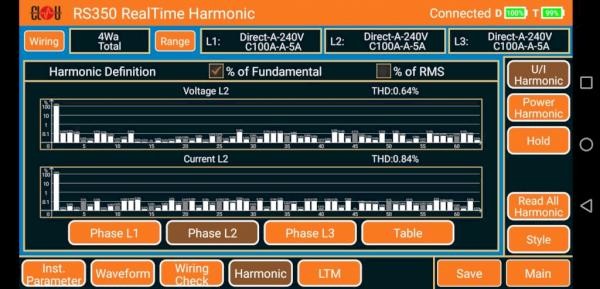
What are harmonics ?
Generally a harmonic is a integer multiple of the fundamental frequency (nominal fn). When we have a fn of 50 Hz, the 3rd harmonics is traveling with 150 Hz. We...
Category: Metering Insights