
If you have already implemented a system for advanced metering infrastructure Advanced Metering Infrastructure AMI (AMI), you know the flood of more or less consolidated information.
Since the meter data management system (MDMS) holds all meter related data, it's only a matter of query to get your required data.  The worst thing is to open the system and find a huge number of alerts. For sure, you will get report lists, showing beside of consumption data also outages and events.
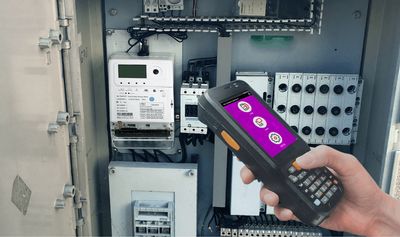
We always recommend using a field deployment tool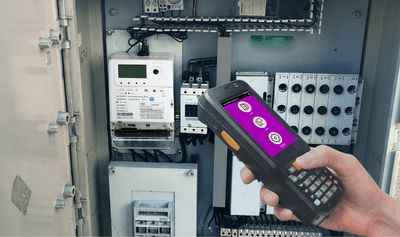 Hand Held Unit for Data Acquisition when installing large batches of smart meters.
Beside of customer information and meter number, you have then also captured the meter position by Global Positioning System (GPS) data.
These GPS data consists of two numbers, one for the longitude and one for the latitude. Only to recall, when you draw a line on a globe from the North Pole to the South Pole, you have a longitude. The reference point is Greenwich (London, UK) with zero degrees. Moving to the East or West adds up to +/- 180°.
Latitude is an angle which ranges from 0° at the Equator to +90° (North Pole) and -90° (South Pole).
With these two coordinates, you can mark locations on a map. For energy meter locations a resolution of 1 m equal to 5 decimals will be fine. An assisted GPS (A-GPS) like used in mobile phones is preferable.
The meter coordinates can either be stored together with the customer data in your customer information system (CIS) or together with the meter data.
From here, the global information system (GIS) module will get the coordinates to put your meters on a map.
That's quite nice, you have a daily overview for your rollout. But a proper GIS can do more.
Imagine, you could have a mapped real-time overview for the situation in the grid. You can have different marker colours for the actual meter status, and identify problem clusters easily without analysing report data.
Your customer service centre can give fast response to calls and the maintenance teams can be dispatched to the locations easily.
Our team has prepared some data for an island deployment. These data are artificial and to make the GIS more understandable. For privacy protection, we can't show real maps here, but the concept is similar.
Nevertheless, you might feel familiar with some customers.
We are using here three marker colours:
green: normal operation
blue: offline (for the last 24 hours)
red: meter is disconnected due to tamper
Additional information can easily be added. For sure, you have your own ideas for optimized data representation.
Thank you for ready and stay safe, wherever you are.
Editor's note: This article was originally published in November 2021 and has been updated for comprehensiveness.


property no.8831
Thank you for your participating. Congrats, you win a coffee.