
Industrial- and commercial customers can be billed on maximum demand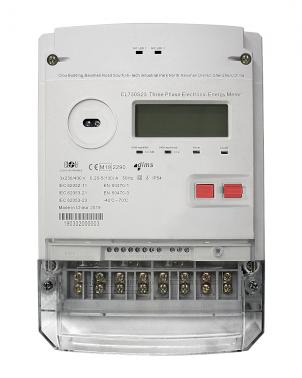 What is Maximum Demand Measurement?. The monthly bill reflects the energy usage in kWh plus a demand surcharge.
It's the oldest method to cover the utility cost for providing additional power generation on demand. The Wright Demand Meter enabled the Chicago Edison company to implement demand tariffs in 1897.
For the load factor calculation, we need beside the energy consumption also the maximum demand.
Load Factor Calculation
\displaystyle\text{load factor} = \frac{ \text{total consumption in kWh for } n \text{ days}}{ \text{maximum load in kW} \times n\ \text{days} \times 24\ \text{hours}}n = number of days
Maximum load is also sometimes called peak load. It is retrieved in certain intervals during a day (e.g. every 15 minutes). Typically, the load factor on the bill is calculated monthly.
The optimum load factor is 1, or expressed in percentage, 100%. If your calculation shows a higher value, there is most likely a ready mistake.
Your electronic energy meter holds various historical registers. You can read on the display e.g. the total consumption for the last month and the maximum load for the last month.
When you are in the lucky position to get load profile dataPractical Use of Load Profiles, you can do some more research.
We've got by courtesy a one-day kWh load profile in 15 minutes intervals for a silicon factory at an undisclosed location. The CT/PT-meter is connected to a voltage instrument transformer Selection of Voltage Transformers 35 kV/100 V and to a current transformer
 Selection of Current Instrument Transformers 300 A/5 A.
Total consumption for one day: 270270 kWh
Maximum load in the same period: 12600 kW
Using the formula, we get a Load factor = 0.89375
What can we do with the load factor?
Now we look in our utility contract for power supply. Most of the contracts are indicating the demand surcharges based on load factor. If your load factor is above 0.75, your electrical usage is reasonably efficient. With our example factory and a load factor of almost 0.9 there is nothing to do.
In this area will be no demand surcharge.
Nevertheless, we can make a quick graph to get an overview about the demand during the day.
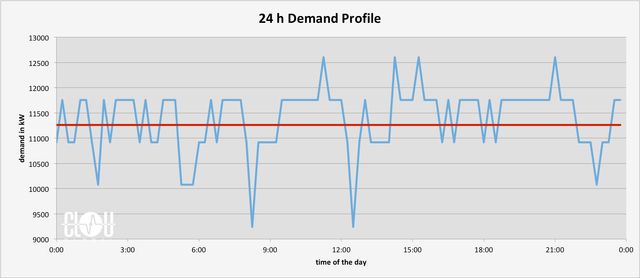
The red line marks the optimum usage of electrical energy for the factory over one day. The value might change over a month or a year. Long time analysis will give you additional benefit. When you feel like the graphic isn't matching with the calculated load factor, look at the y-axis. We have an offset of 9000 kW.
Typical Load Factors for Commercial Properties
| Type | Average Load Factor |
|---|---|
| Hospital | 0.55 to 0.65 |
| Supermarket | 0.5 to 0.6 |
| Hotel | 0.45 to 0.6 |
| Restaurant | 0.5 to 0.55 |
| Office | 0.45 to 0.55 |
| Small Manufacturing | 0.35 to 0.5 |
How to improve the load factor?
Try to avoid having too many consumers running at the same time. Some machinery is process related and can't be controlled easy. Other applications are entirely in your hands.
For example, it's not necessary to start all air-conditioners at the same time. Shift and control them in groups to avoid a peak within 15 minutes.
Keep in mind, it's not a short-time surge during switching loads which brings your maximum demand up, it's the average consumption over the integration period.
Thank you for reading and keep your load factor high.
Editor's note: This article was originally published in November 2021 and has been updated for comprehensiveness.


Dear Reinhard Günther,
Thank you for your important contribution to this article.
Could you send me your article in pdf format and provide the website?.
Thanks.
Luis López.
Dear Luis,
Thank you for your interest in our article. We appreciate your feedback!
I'd like to clarify that we have been writing and formatting our articles directly in the CMS for the past six years, which means we do not have any documents available in PDF format. However, you can access the article directly on our website for the most up-to-date information.
Best regards,
Reinhard
Good news
Thank you for reading and kind comment.