Electronic energy meters can save internally a lot of data. When this data are saved periodically with time stamp, we talk about a load profile.
We can have daily, weekly or monthly load profiles with 16 channels or more. Mostly used are daily load profiles with 96 or 48 record-sets per day. (15 or 30 minutes intervals)
The meter can keep the data locally for a while (typically half year, it's only depending on the internal memory size). Real benefit comes from an AMI system integration.
An load profile example from a recent project:
The customer has direct connected three-phase meters and he gets a 15 minutes load profile for the following items. Each item is one channel. (Average means within 15 minutes, but you know this already.)
- average voltage L1
- minimum voltage L1
- maximum voltage L1
- average voltage L1-L2
- minimum voltage L1-L2
- maximum voltage L1-L2
- average voltage L2-L3
- minimum voltage L2-L3
- maximum voltage L2-L3
- average voltage L3-L1
- minimum voltage L3-L1
- minimum voltage L3-L1
- average current L1
- minimum current L1
- maximum current L1
- average current L2
- minimum current L2
- maximum current L2
- average current L3
- minimum current L3
- maximum current L3
- average power, active
- minimum power, active
- maximum power, active
- average power, reactive
- minimum power, reactive
- maximum power, reactive
- average power factor
- minimum power factor
- maximum power factor
- active energy, import
- active energy, export
- reactive energy, Q1
- reactive energy, Q2
- reactive energy, Q3
- reactive energy, Q4
This load-profile consists of 36 channels. Remember, we are still talking about a direct connected three-phase meter.
Data volume
Compressed we have 54 KB per day on the server. Due to authentication and encryption the traffic to forward the data is about 70 kB.
Now imagine that we have 200,000 meters. Then the server gets 10.8 gigabyte (GB) data every day. The daily traffic by 3G/4G network will be around 14 GB. Even when you are using PLC (power line communication) all data are sent finally by telecommunication network. This cost need to be considered.
When I look on the above load profile I would skip some items. For asymmetrical voltages we have other methods to record. Also I miss the record of the grid frequency.
My personal favourite for producing data is a utility in Middle-East with 125 channels every 15 minutes.
What? You can do this, only the individual harmonics from 2nd to 21th order plus sum-distortion per harmonics order are giving you 90 channels. And this is only the average distortion. We could easy extend the data by recording also minimum and maximum…
We now come to the point, which data are reasonable.
Which data are reasonable?
It depends, as usual.
From your end-customer point of view it's nice to provide some consumption analysis on daily base in a web interface. Here he can see the consumed energy in 15 minute intervals. Then he can take actions to shift certain activities to times with lower tariff rates or he can see the benefit of disconnecting TV, Sat-Top box, Wifi router, computer etc. during the night or during absence from his home.
So we are recording the energy import data. If the customer is feeding back power to the grid (renewable energy) it's also good to use a channel for recording the energy export data.
For a domestic customer this information should be sufficient.
For the utility or power company other data are more valuable. You are not really interested in a single meter, except of tamper condition.
Whatever can improve the grid power quality is interesting. But you need to understand the data and you must have the possibility to take improvement actions. Otherwise all data is meaningless.
Let's take a look
Imagine a location in Asia on a lovely Friday. We have a 750 kVA three-phase distribution transformer (11 kV/400 V). The transformer operated meter (CT-meter) is giving us the 15 minutes load profile for various parameters (channels).
So we know the load at the transformer. This covers the consumption of all meters behind the transformer and also eventually tamper by hooking. But this is a different story.
All diagrams represent the behaviour for a single day. In case of interest the transformer needs to be monitored for a longer period. If you are top-analyst you will also compare the charts vs. the actual weather conditions :)
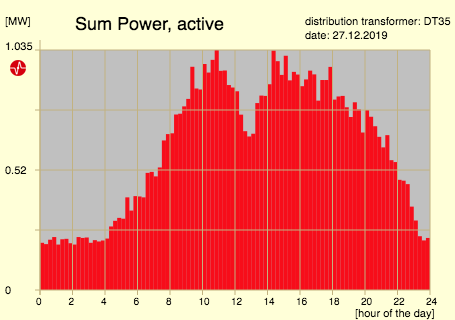
From the profile we can see high consumption during the day. By the lunch time drop I would guess it's some light industry, maybe together with dormitory or some apartments. We can even figure out the lunch-time.
We get valuable information about the transformer capacity.
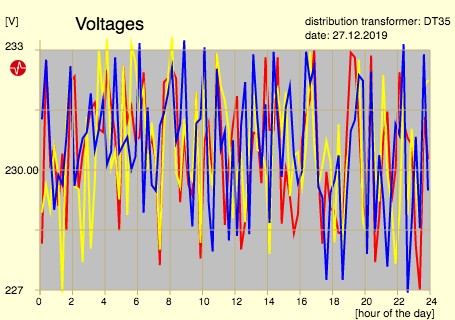
This diagram shows the voltage fluctuation (average values). Remember the request above to record also the minimum and maximum voltages during 15 minutes.
What can we learn?
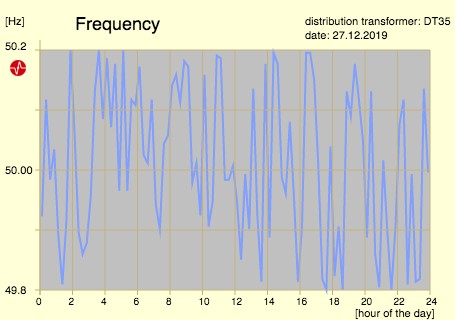
The voltages are following to some extend the grid frequency.
In my opinion monitoring the frequency is the better choice. It saves also a lot of data.
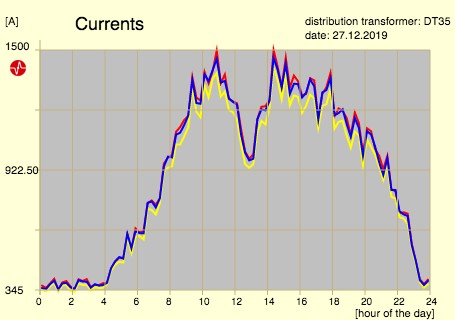
The load at a distribution transformer should be balanced. By recording the single currents we know whether some action is necessary.
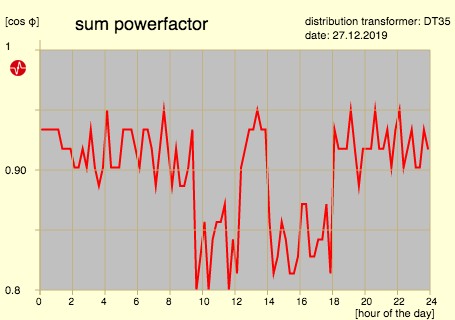
From the power factor we can see whether a compensation is necessary at the transformer.
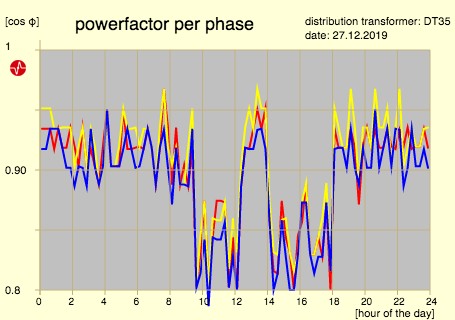
You can also monitor the power factor per phase for some dedicated research at one transformer.
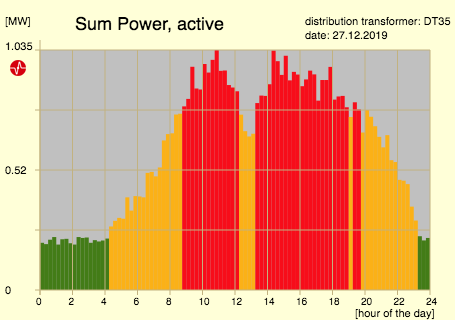
You can use the sum power information also to plan your tariff structure.
Here consumption below 25% is coloured green and above 75% red.
When you make an overlay for all distribution transformers in a region, you get a good idea how to organize the tariffs.
For the industrial consumer you can learn about the maximum demand limitations.
Conclusion
You can save all available metering data in load profiles. Not all data are really helpful for improving the power grid quality. A proper AMI system can help you with the analysis. The more meters you run with remote readings, the less important is the single meter.
Finally you need to have the consolidated information for a region or for your complete grid.
This post is a first approach to the practical use of load profiles. I'm sure that there are many questions open. Please drop us a comment and as usual, thank you for reading.
Editor's note: This article was originally published in December 2019 and has been updated for comprehensiveness.
Thanks LaoRren. I have a question for you. When we started changing all analog revenue meters for digital ones from US on 1982-1984 in Chile and some other countries of Latin America, most Generation Companies did not control the Frecuency of the Grid, because this US rev Meters used to work in US with the clocks fed with the frecuency of the grid, so we must change to internal clocks, but they move around 10-15 minutes per 2-3 months, ( very bad), and now most of the revenue meters in Latin America are with internal clocks with battery, with bad problems to mark fault events, To make them better have Irig B to install GPS, but most do not use because is more expensive. Can help me with this please?
Thanks you accept to offer Webinars, we can do with you, but suggest in Spanish. Thanks.
I understand. I come back to you by PM.
As usual a very good info. Most of customer do not use metering their transformers, so I see with your paper it is very important to have them, for different users and benefits: to know loads of each transformers, power quality and how much contamination they are receiving ( armónica, flickers, black outs, etc), also in a future study fo cut energy to control volts, KW On Peak Hours, et., etc. So, thanks for so good paper. Now we must work on show their benefits to users. As it is now, perhaps a Webinar to a group of users would be good. Thanks
Thank you for your comment, Mariano. Regarding flicker please check the additional information here. Due to the COVID-19 travel restrictions we are maintaining our metering blog by giving practical information about all aspects of electrical energy metering and testing. Having also webinars is a good suggestion.
Thank you.