
We continue from the article about waveform sampling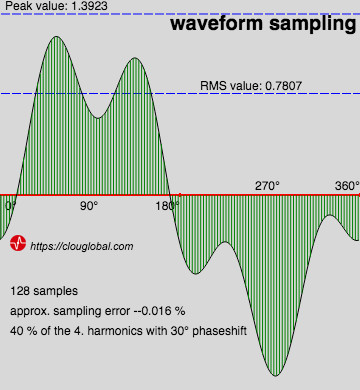 Waveform Sampling for Electrical Measurements. There we saw that the mean value of the wave is calculated with the RMS formula. RMS means root mean square.
A mean value gives us an average over a certain number of measurements. This is simplified, math professors can stop reading here.
These mean values can be calculated with different methods, e.g.
– arithmetic mean
– geometric mean
– harmonic mean
– truncated mean
– interquartile mean
– winsorized mean
For our wave sampling we can't take any of them. We need to calculate the RMS value. The arithmetic mean formula will give for a pure sine-wave cycle always a value of zero.
Arithmetic Average Formula
\displaystyle \overline{x} = \frac{x_1 + x_2 + x_3 + \ldots + x_n}{N}RMS Calculation
\displaystyle RMS = \sqrt{\frac{x_1^2 + x_2^2 + \ldots + x_n^2}{N}}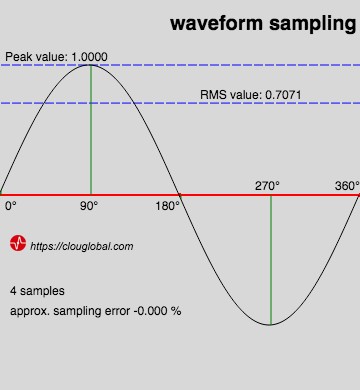
CLOU energy meters and test equipment is measuring the true RMS value by waveform sampling. There are other methods, but they are less accurate. As long as your meter has passed the IEC type tests , you can be sure that the meter is also measuring accurate distorted What are harmonics ? waves.
What happens after the Sampling?
After the sampling period is finished you have the real time values. These values are taken for all internal calculations. For visualization the bunch of data needs to be consolidated. The upper display shows the last true-rms value. Below we take an average over the last 10 samples and round the result to two digits. Both displays are getting the values from the same source.
| Update speed |
V
L2
52.24.0
V
L2
52.24.0
You see that the second display is easier to read and to understand. If you'd like to be more confused, just switch to an update speed of 100 ms. In the meter and/or in the AMI system Introducing ClouESP AMI Software, your ultimate energy management solution the data can be more averaged, depending on the statistical purpose. For example in load profiles you can usually find a 15 minutes mean value for the voltage.
What do we learn?
Digital energy meters Discover the Power of Electronic Energy Meters with Our Expertise and other digital measurement equipment
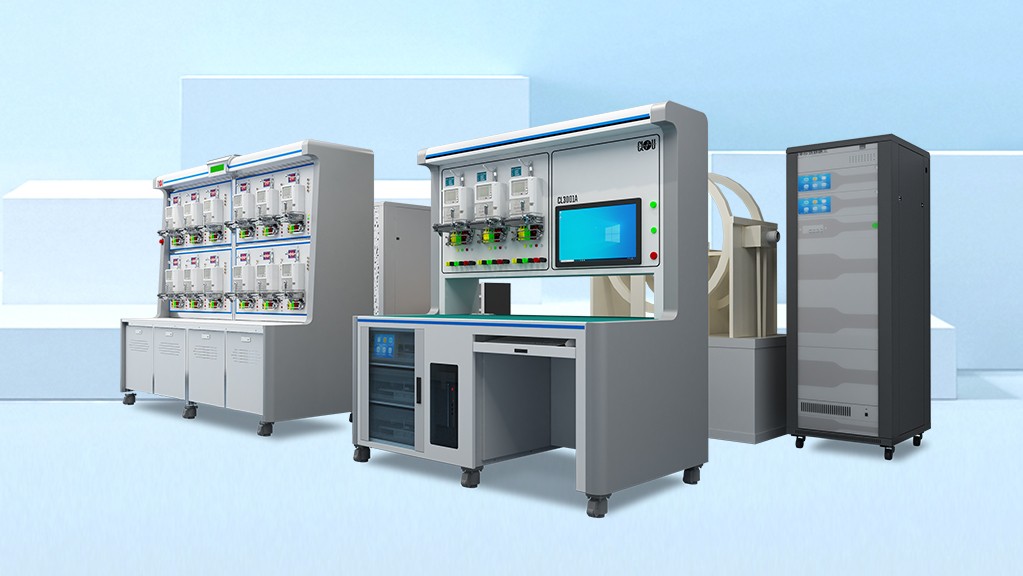 Introducing Our High-Quality Meter Test Equipment for Precise Measurements are showing fast changing numerical values. While you can see the trend on an analogue scale very easy, you need to monitor the digit change for a while and average in mind. Smart meter manufacturers are simplifying this procedure. CLOU display indications are by default averaged over 4 cycles. The stored instantaneous values are holding always the content of the last sample.
Displayed values can be mean.
Thank you for reading.
Editor's note: This article was originally published in October 2020 and has been updated for comprehensiveness.


All comments are moderated before being published. Inappropriate or off-topic comments may not be approved.