
The section 9.4.11 of the IEC62052-11 Edition2 is about the influence of self heating. We need to figure out whether the occurring internal heat is causing a temporary error drift above the allowed limits for variation. You can find the variation limits in the applicable standard for your meter, e.g. in the IEC62053-21 for electronic energy meters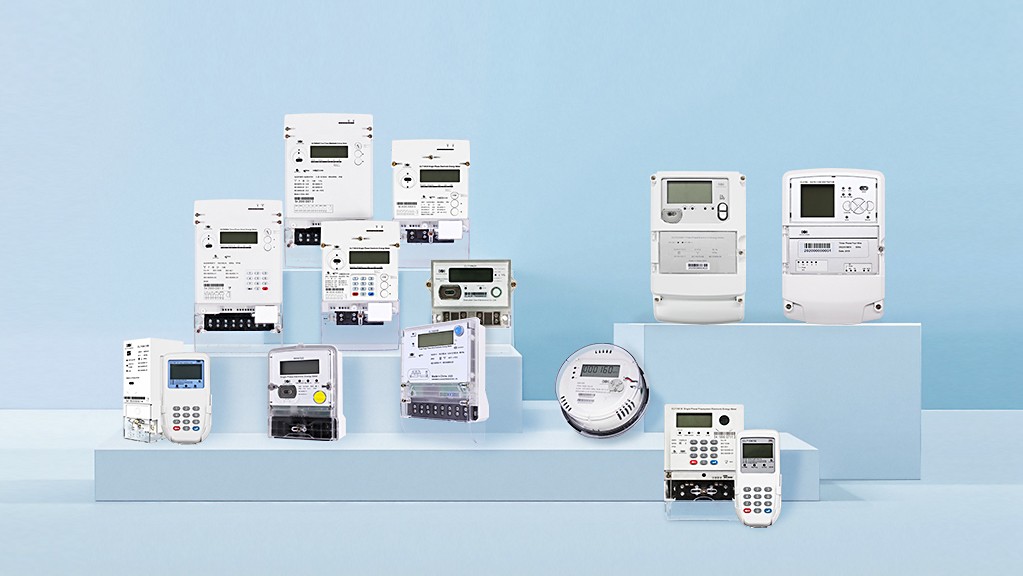 Discover the Power of Electronic Energy Meters with Our Expertise class 1 and class 2.
The Test Procedure
The IEC requires a connection cable length of 1 m and a cross-section to get a current density between 3.2 A/mm2 and 4 A/mm2. As we are lazy and doing this tests only informative, we put the meters on a test bench. The current density is matching with the test bench wiring, but the cables are too short. The impact is that the meters are getting likely warmer due to external influence. In the worst case this will lead to a false fail.
The meters are energized with Un (230 V) for two hours without any current. Then we apply the maximum current (60 A, PF1) to the current circuits.
Now the original IEC wordings: The meter error shall be measured at unity power factor immediately after the current is applied and then at intervals short enough to allow a correct drawing to be made of the curve of error variation as a function of time.
Which interval is short enough? And, have you ever seen someone making a drawing of the variation over the time? Good, the IEC talks about "allow a correct drawing", means it's not mandatory to make one.
Anyway, due to the fact that the IEC is here not really specific, we have set up our own procedure. We measure the meter error once per minute by using a time-based pulse calculation over 10 seconds. This time is sufficient because our reference standard has a three times higher resolution than competitor products. You can also take a look at our pulse calculator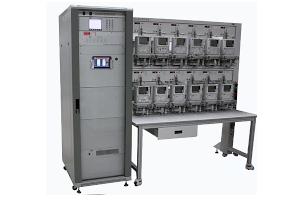 Pulse Calculation for Stationary Test Benches. For power factor 1 and 10 seconds we have a resolution of 1.1 ppm, for power factor 0.5 it's 2.2 ppm.
So, we will not have a systematic error from too short testing time.
We are doing an error test for each position once per minute for the whole testing periods.
The meters are tested for one hour for each of the conditions below:
- Imax, active energy, power factor 1
- Imax, active energy, power factor 0.5L (inductive)
- Imax, reactive energy, power factor 1
- Imax, reactive energy, power factor 0.5L (inductive)
So, the whole test takes >6 hours equipment occupation.
The test bench Stationary Meter Test Equipment together with the control software
 Electrical Measurement Studio EMS5 is doing the test automatically. The PC screen is updated after each error measurement. The final test report has the same content including all graphics for each test point and all positions. There is also a possibility for remote monitoring via web server.
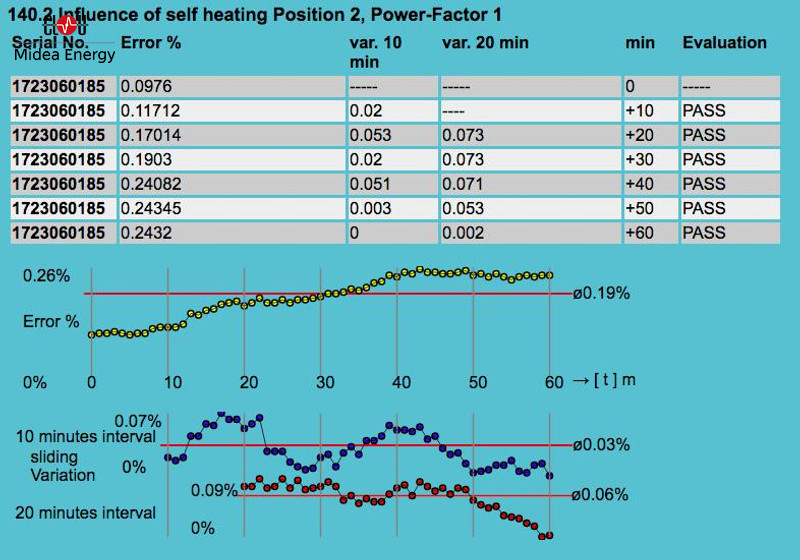
What do we learn from the screenshot?
We have the initial errors, a 10 minutes variation (for fun, not required) and a 20 minutes variation. Beside the absolute variation limits you need also to make sure that the meter accuracy doesn't change for more than 0.2%.
We see (yellow dot's) that the meter error is slightly increasing up to minute 45, then the error remains stable. The 20 minutes interval (red dots) is almost going down to zero (0.02% variation). So even with the short current connection cables we are very far away from the allowed variation limits of +/-0.7%
Thank you for taking a look and "Happy Testing".
Editor's note: This article was originally published in July 2020 and has been updated for comprehensiveness.


All comments are moderated before being published. Inappropriate or off-topic comments may not be approved.